Afficher une image
dp = "data"
try:
	jetplane = cv2.imread(f"{dp}/jetplane.tif", 0)
	jetplane_mean = np.mean(jetplane)

	plt.title("Image originale")
	imgplot = plt.imshow(jetplane, cmap="gray")

except Exception as err:
	print(f"Erreur: {err}")
Mean:
mean = np.mean(jetplane)
Spectre d’amplitude non centré
F = np.fft.fft2(f) # 2 for 2D
plt.figure(figsize=(5, 5))
plt.imshow(np.log10(np.abs(F) + 1), cmap='gray')
plt.title("Spectre d'amplitude non centré")
plt.show()
Valeur du coef 0, 0
print(f"F[0,0]: {F[0,0].real}")
Taille de l’image
print(f"Taille de l'image: {F[0,0].real/np.mean(f)}", )
print(f"Taille de l'image: {f.shape[0]*f.shape[1]}", )
Valeur moyenne a partir de 0, 0
nl, nc = f.shape
print(f"Nombre de lignes: {nl}")
print(f"Nombre de colonnes: {nc}")

valMoy2 = F[0,0].real/(nl * nc)

print(f"Aide: Valeur moyenne from F[0,0]: {valMoy2:.2f}")
Fonction dirac
def d(k):
	return 1 if k == 0 else 0
Plot des diracs
def x(k):
	return d(k) - d(k - 1)

a = np.arange(-10, 10, 1)
plt.stem(a, list(map(x, a)))
plt.show()

plt.figure()
plt.stem(a, list(map(x, a)), use_line_collection=True)
plt.xlabel('x Label')
plt.title('Title')
plt.grid(True)
plt.show()
Convolution sur deux listes
a = np.arange(-5, 7, 1)
xx = list(map(x, a))
hh = list(map(h, a))
cc = np.convolve(xx, hh, mode="same") # Same to get the same size
plt.stem(a, cc)
plt.show()
Filtres
Median (retirer Poivre et sel)
img = cv2.medianBlur(img, 3)
plt.imshow(img, cmap='gray')
On peut aussi plug ce le kernel dans cv2.filter2D:
Filtre donné (Rehaussement de contours)
$$ \left(\begin{array}{cc} -1 & -1 & -1\ -1 & 9 & -1\ -1 & -1 & -1\ \end{array}\right) $$
kernel = np.array([[-1, -1, -1], [-1, 9, -1], [-1, -1, -1]])
img2 = cv2.filter2D(img, -1, kernel)
print(f"Type de donnée de l'image: {imR.dtype}")
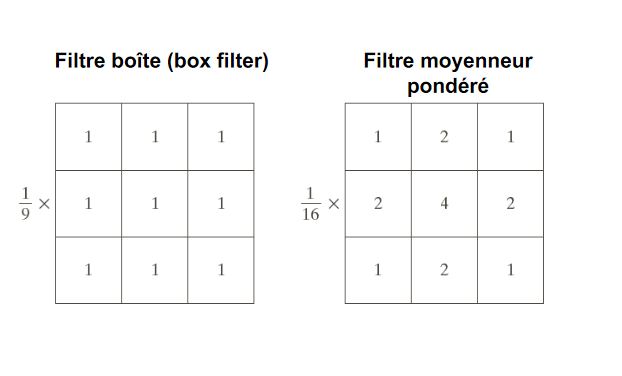
Filtre moyenneur:
n = 15
kernel = np.ones((n,n),np.float32)/n**2
imgf = cv2.filter2D(src=img,ddepth=cv2.CV_32F,kernel=kernel)
Seuillage Threashold
ret,thresh = cv2.threshold(imgf,60,1,cv2.THRESH_BINARY)
result=img*thresh

or

# Seuillage pour obtenir le résultat final
threshold = 700
threshS = np.uint8(sobelxy > threshold)
gaussian blur
gaussian= cv2.GaussianBlur(median,(5,5),0)
Sobel (Detection de contour)
sobelx = cv2.Sobel(median, cv2.CV_32F, 1, 0, ksize=5)
sobely = cv2.Sobel(median, cv2.CV_32F, 0, 1, ksize=5)

# Approximation de la norme du gradient
sobelxy= np.absolute(sobelx) + np.absolute(sobely)
Laplacien (Detectin de contour)
laplacian = cv2.Laplacian(median,cv2.CV_32F)
Code
import numpy as np
from PIL import Image
from matplotlib import pyplot as plt
import numpy.typing as npt
from copy import deepcopy
from typing import Tuple
from time import perf_counter
from enum import Enum


Img = npt.NDArray[np.uint8]
Uint_arr = npt.NDArray[np.uint8]

PATH_IMAGES = "./ressources_labo2"


class Isotropy(Enum):
    ISO_90 = 1
    ISO_45 = 2


def load_img(path: str) -> Img:
    img = Image.open(path)
    return np.array(img)


def show_img(img: Img) -> None:
    plt.imshow(img, cmap="gray")


def threshold(img: Img, th: np.uint8) -> Img:
    return (deepcopy(img)[:, :] > th) * 255


def convolution(img: Img, kernel: Img) -> Img:
    # https://stackoverflow.com/questions/35751306/python-how-to-pad-numpy-array-with-zeros

    # Pad the image with zeros so that the kernel can be moved across the image
    # without going out of bounds
    pad_height = kernel.shape[0] // 2
    pad_width = kernel.shape[1] // 2
    img = np.pad(img, ((pad_height, pad_height),
                 (pad_width, pad_width)), mode='constant')
    out = np.zeros_like(img)
    for y in range(pad_height, img.shape[0] - pad_height):
        for x in range(pad_width, img.shape[1] - pad_width):
            # Get the current region of the image
            region = img[y - pad_height:y + pad_height +
                         1, x - pad_width: x + pad_width + 1]

            out[y, x] = np.sum(region * kernel)

    # Crop to og size
    return out[pad_height: img.shape[0] - pad_height, pad_width: img.shape[1] - pad_width]


def blur_avg(img: Img, blur_size: int) -> Img:
    kernel = np.ones((blur_size, blur_size)) / blur_size**2
    return convolution(img, kernel)


def noise(img: Img, white_p: float, black_p: float) -> Img:
    # For each pixel, there is a white_p chance that it will be set to 255
    # and a black_p chance that it will be set to 0
    # Otherwise, the pixel will be left unchanged
    white = np.random.choice([0, 255], img.shape, p=[1 - white_p, white_p])
    black = np.random.choice([0, 255], img.shape, p=[1 - black_p, black_p])
    return np.where(white == 255, 255, np.where(black == 0, 0, img))


def rgb_to_gray(img: Img) -> Img:
    res = np.zeros((img.shape[0], img.shape[1]))

    with np.nditer(res, flags=['multi_index'], op_flags=['readwrite']) as it:
        for e in it:
            x, y = it.multi_index
            e[...] = img[x, y, 0] * 0.2989 + \
                img[x, y, 1] * 0.5870 + img[x, y, 2] * 0.1140
    return res


# HERE
def laplace(img: Img, isotropy: Isotropy) -> Img:
    if isotropy == Isotropy.ISO_90:
        k = np.array([[0,  1, 0], [1, -4, 1], [0,  1, 0]], dtype=np.uint8)
    else:
        k = np.array([[1, 1, 1], [1, -4, 1], [1, 1, 1]], dtype=np.uint8)
    return convolution(img, k)


if __name__ == "__main__":

    hotel = load_img("hotel.png")
    # hotel = noise(hotel, 0.2, 0.3)
    # test = load_img("testpattern1024.png")

    # hotel = rgb_to_gray(hotel)

    show_img(hotel)
    # show_img(laplace(hotel, Isotropy.ISO_90))

    plt.show()